Plotting graphs after evaluation on benchmark
Assuming you have your working directory set up and configured vot-workspace and that you have already performed the evaluation on your tracker, all you have to do is:
- run Matlab/Octave,
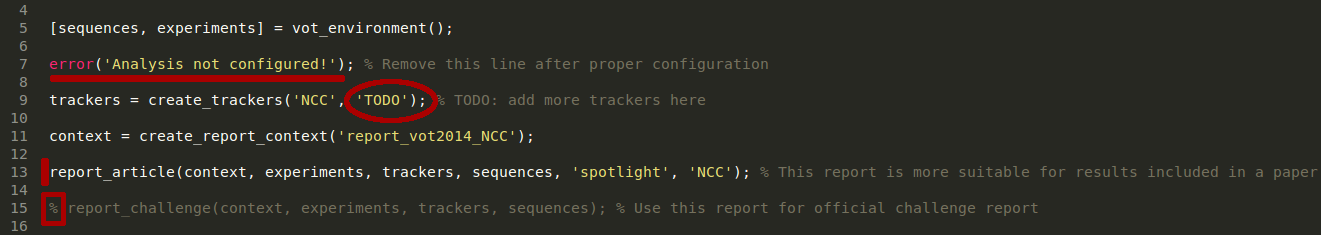
- edit `vot-workspace/run_analysis.m` and modify it according the instructions below,
- download the reference trackers results, and
- execute the `run_analysis` script.
Modifying the script run_analysis.m
To evaluate on VOT2013 benchmark
- download the [results file](https://data.votchallenge.net/vot2014/vot2013_results.zip). This file contains results of all trackers from VOT2013 challenge.
- Extract the archive to `vot-toolkit/results`.
- Remove `error` command.
- Modify `trackers` variable such that `trackers = tracker_load(vot2013.txt', '{{yourtracker}}')`, where `{{yourtracker}}` is the name of your tracker.
- Comment `report_article`.
- Uncomment `report_challenge` command.
Disclaimer: Due to ongoing changes in the toolkit some results for VOT2013 may not be completely identical to the official ones. We are currently working to obtain the published results.
To evaluate on VOT2014 benchmark
- download the [results file](https://data.votchallenge.net/vot2014/vot2014_results.zip). This file contains results of all trackers from VOT2014 challenge.
- Extract the archive to `vot-toolkit/results`.
- Remove `error` command.
- Modify `trackers` variable such that `trackers = tracker_load(vot2014.txt', '{{yourtracker}}')`, where `{{yourtracker}}` is the name of your tracker.
- Comment `report_article`.
- Uncomment `report_challenge` command.
To generate results for your paper
- Download the raw results for the trackers you want to compare to (e.g. from VOT2013 challenge).
- Set the `trackers` variable according to instruction above (for VOT2013/2014).
- Uncomment `report_article`.
- Comment `report_challenge` command.